
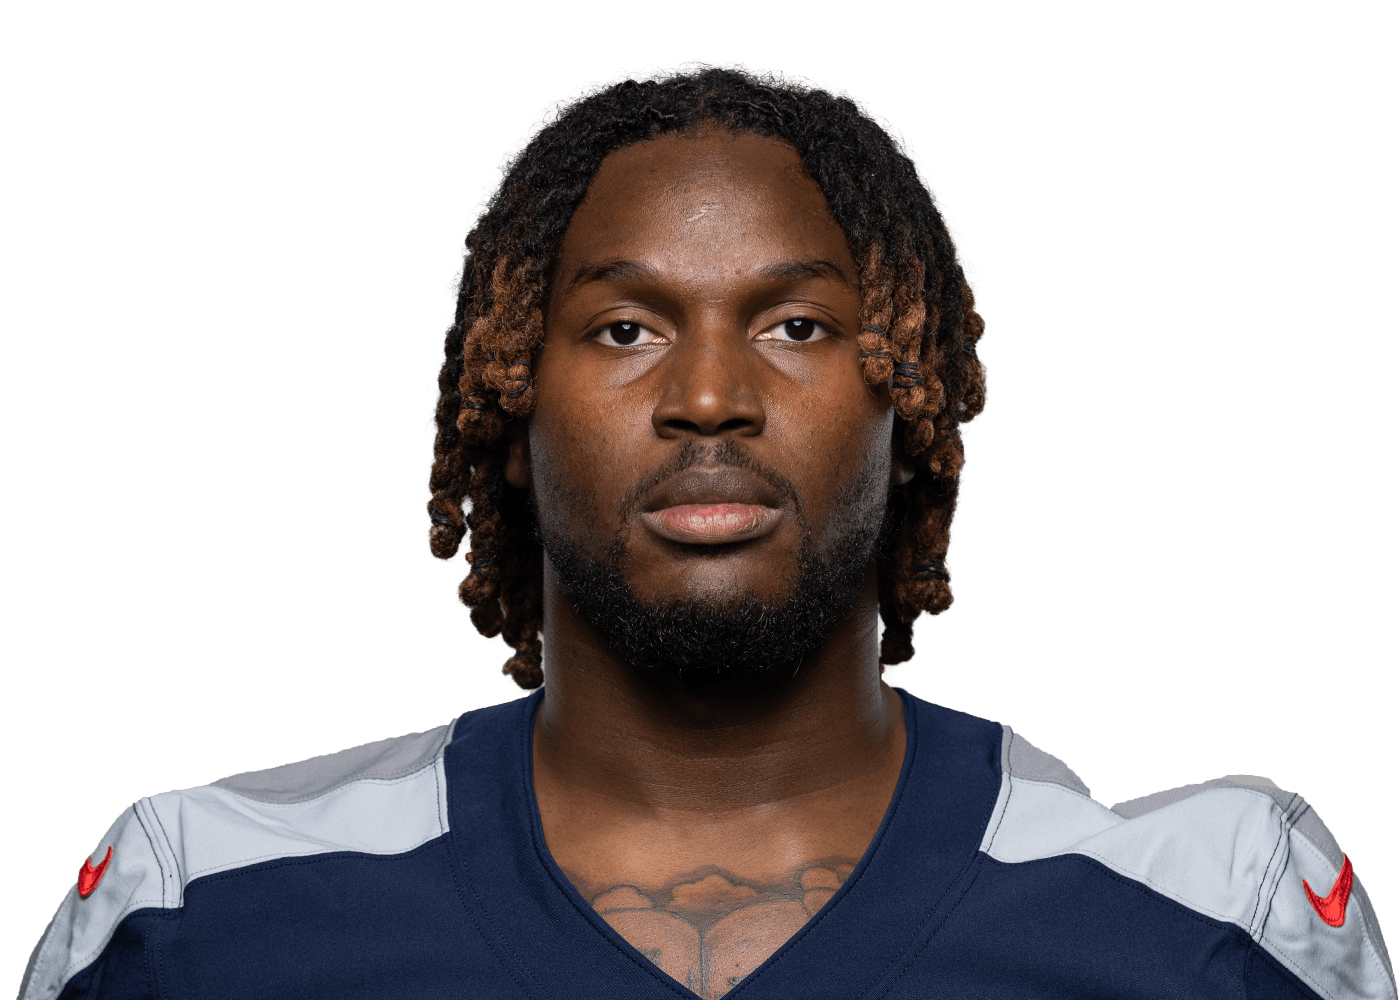

No projection this week
Dontrell doesn't have a projection right now — either his team is on a bye, the week's slate hasn't been simulated yet, or he isn't in a position to draw usage. His game log and the usage read below are the real record either way, and this page picks him back up as soon as there's a game to simulate.
How much he's on the field
Dontrell has averaged 32% of his team's snaps across 20 games. That's a limited role, and it caps everything else on this page. A player on a third of the snaps can't produce like a starter no matter how efficient he is, and the projection reflects the opportunity rather than the talent. Opportunity is the first thing the model reads and the last thing it gives up on — production without snaps is noise, and snaps without production usually corrects.
What kind of back he is
Dontrell has 78 carries for 495 yards (6.3 a carry) and 2 rushing touchdowns. He's also seen 55 targets for 277 yards — pass-game work is what separates a back who plays on third down from one who leaves the field, and it's worth more to a projection than the same yardage on the ground. Running-back yardage swings hard on the blocking in front of him, which is why the model weighs opportunity — carries and targets — above efficiency.
His last 5 games
Over that stretch Dontrell has 61 total yards. In a sport with seventeen games, a five-game window is closer to an anecdote than a trend — which is why usage, not this, anchors the number.
How the model reads him
The number on Dontrell is a share of a simulated game. First the matchup: possessions, field position, how each offense is likely to move. Then his slice of it, set by usage rather than by reputation. How those pieces are weighted is ours and gets re-tuned against results; the output is published and graded, which is the half you can check.
What we'd flag
Football's sample sizes are brutal — seventeen games a season means a "trend" is often four data points. Injuries and game script move usage more than talent does week to week, and a blowout can erase a starter's second half. For Dontrell specifically, he's on the field for a minority of snaps, which caps the projection regardless of how he's playing.