
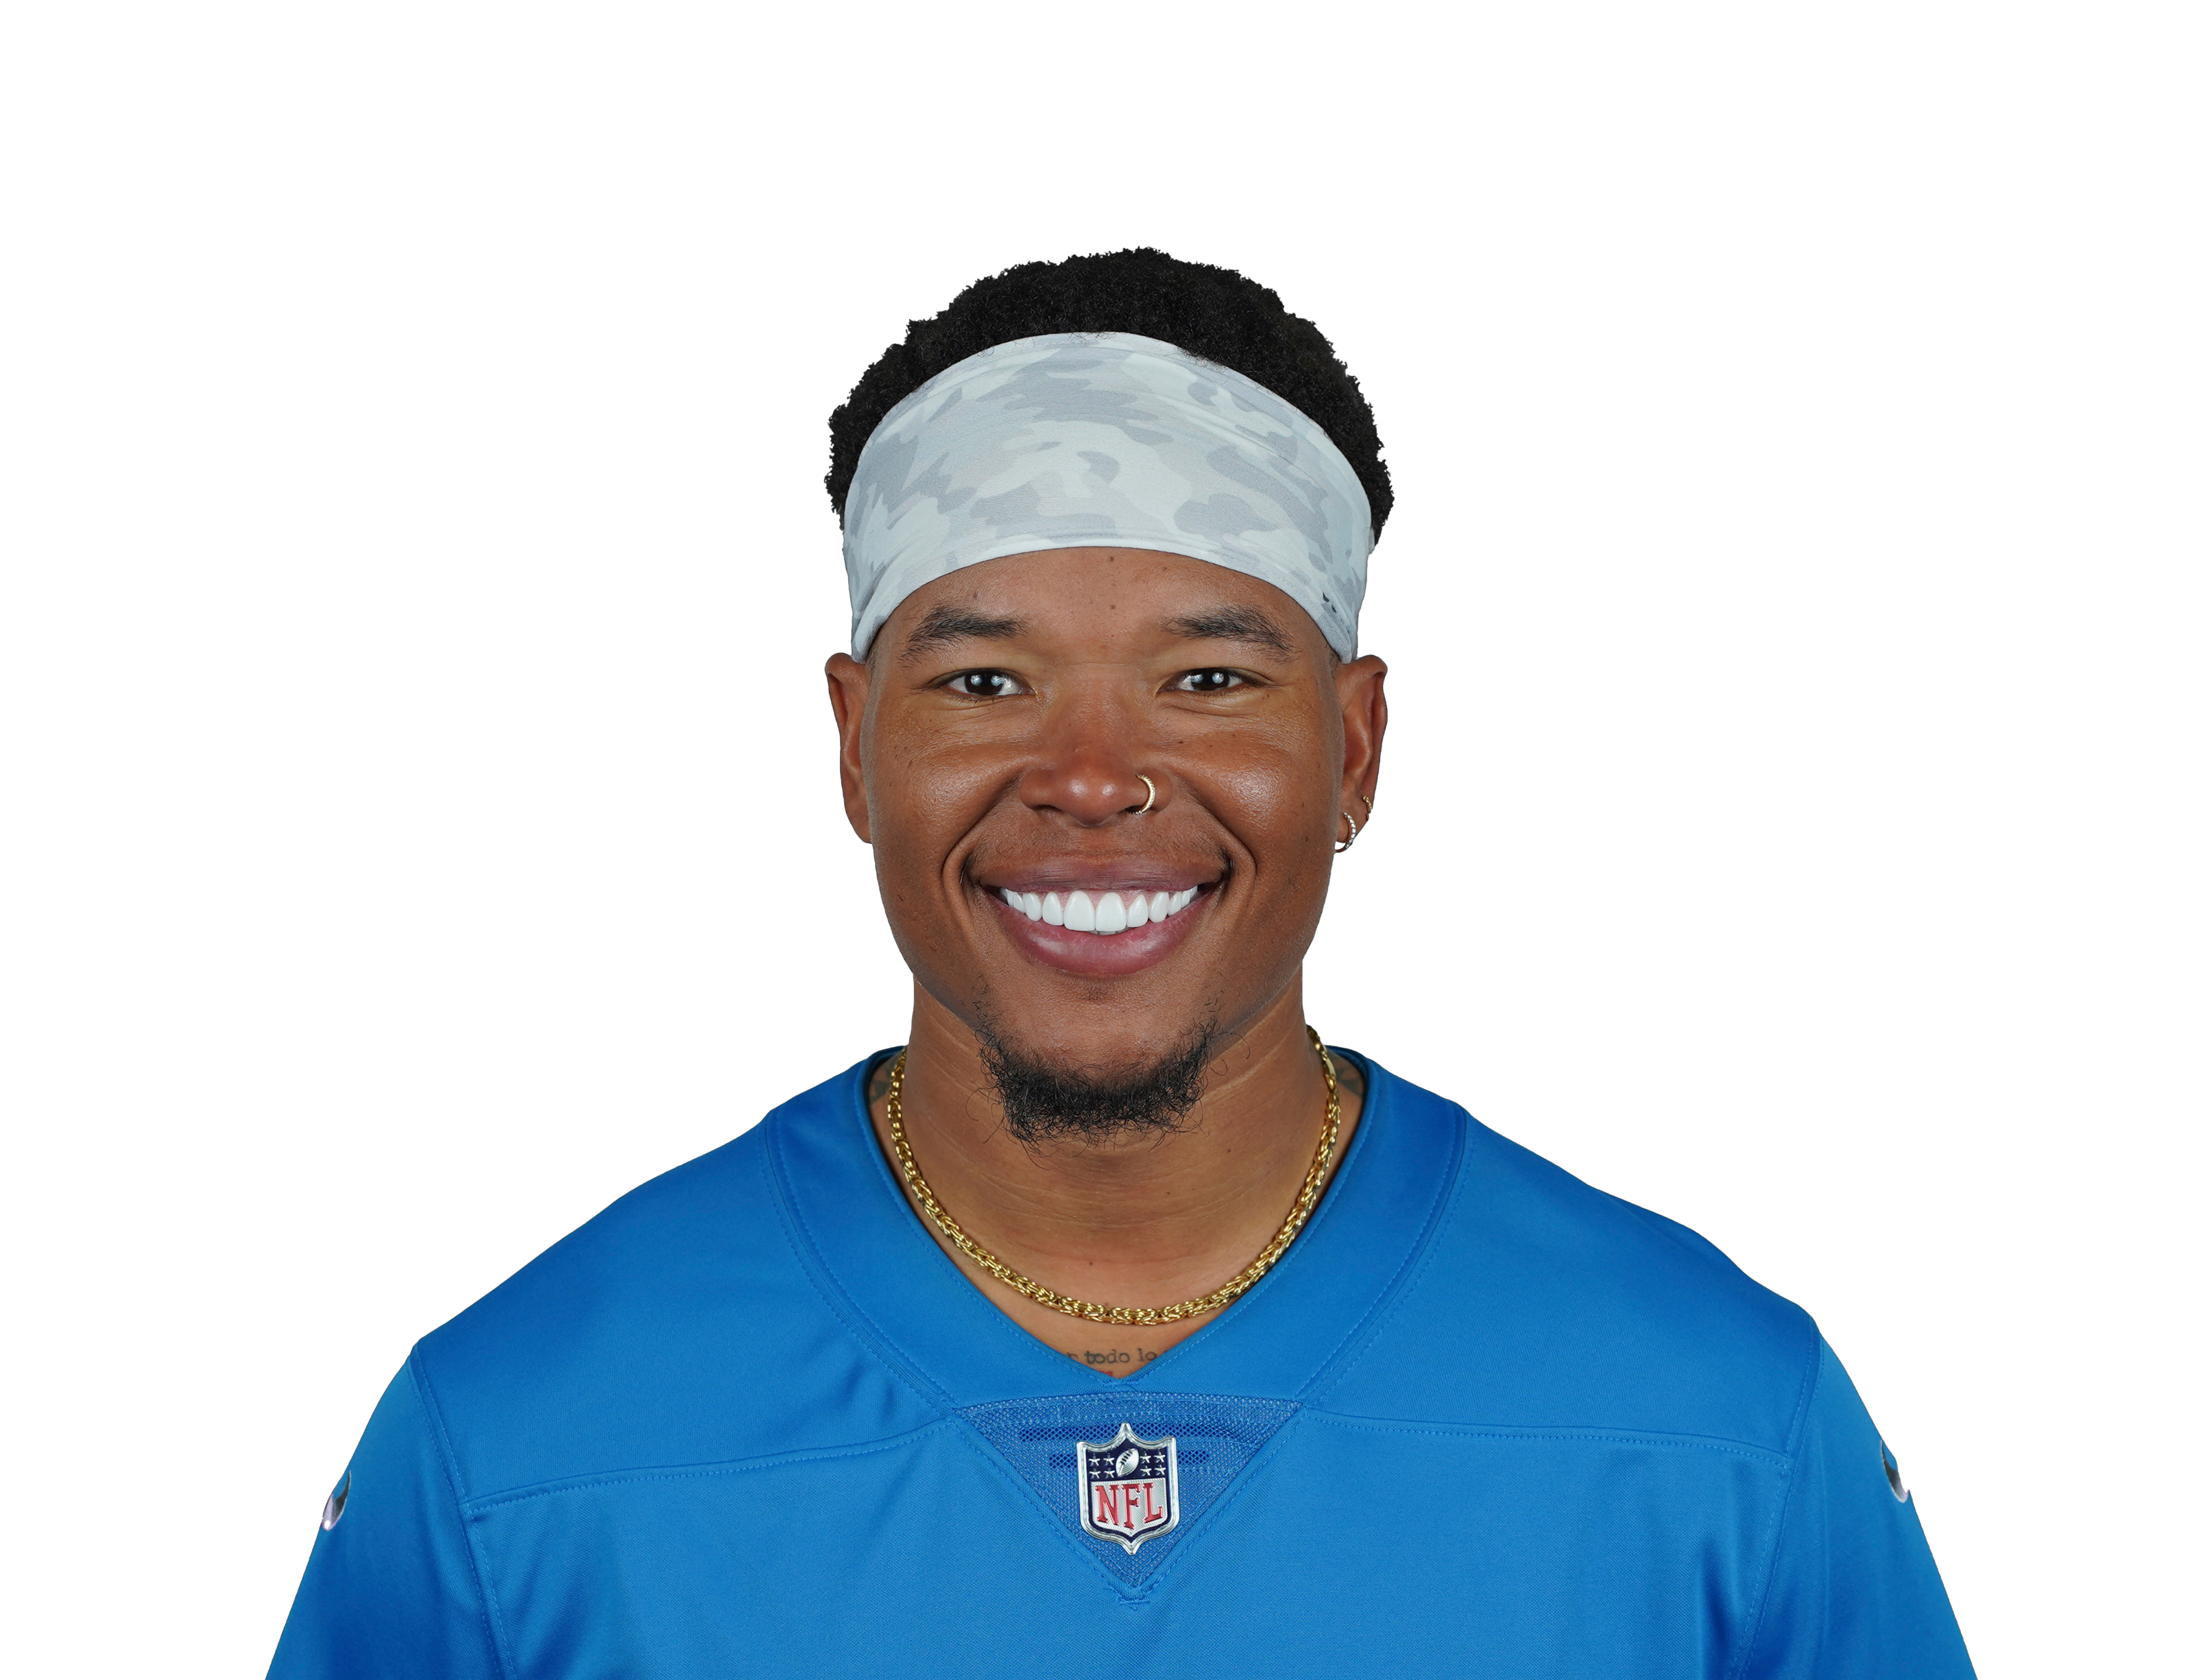

No projection this week
Marvin doesn't have a projection right now — either his team is on a bye, the week's slate hasn't been simulated yet, or he isn't in a position to draw usage. His game log and the usage read below are the real record either way, and this page picks him back up as soon as there's a game to simulate.
How much he's on the field
Across 20 games, Marvin has been on the field for 61% of his team's snaps. That's a rotational-to-starter share. It's the number most likely to move his projection week to week, because a swing of ten points of snap share moves everything downstream with it. The model weighs this above efficiency for a simple reason: snap share predicts next week better than last week's yardage does.
What kind of receiver he is
Marvin has caught 48 of 89 targets (54%) for 543 yards and 4 touchdowns — 6.1 yards per target. Yards per target is the honest efficiency number here, because catch rate mostly measures how far downfield he's used: a slot receiver on screens will always catch more of them than a deep threat, without being better.
His last 5 games
Over that stretch Marvin has 56 total yards. Worth noting: his snap share is trending down — 49% lately against 61% overall. Five games is a small sample in any sport and a tiny one in football, where a team plays seventeen times a year — so recent form informs the projection without overriding the usage underneath it.
How the model reads him
Every projection here is built the same way for Marvin as for a starter on a contender — simulate the game, then apportion it by role. No manual adjustments, no gut calls on who's due. The weighting behind it is proprietary and re-tuned on real outcomes; everything it produces is public and graded against the box score.
What we'd flag
Three things to carry. The season is seventeen games, so most trends here are small samples wearing a confident number. Game script rewrites usage — a team trailing throws, a team ahead runs. And injury news lands after we publish.