
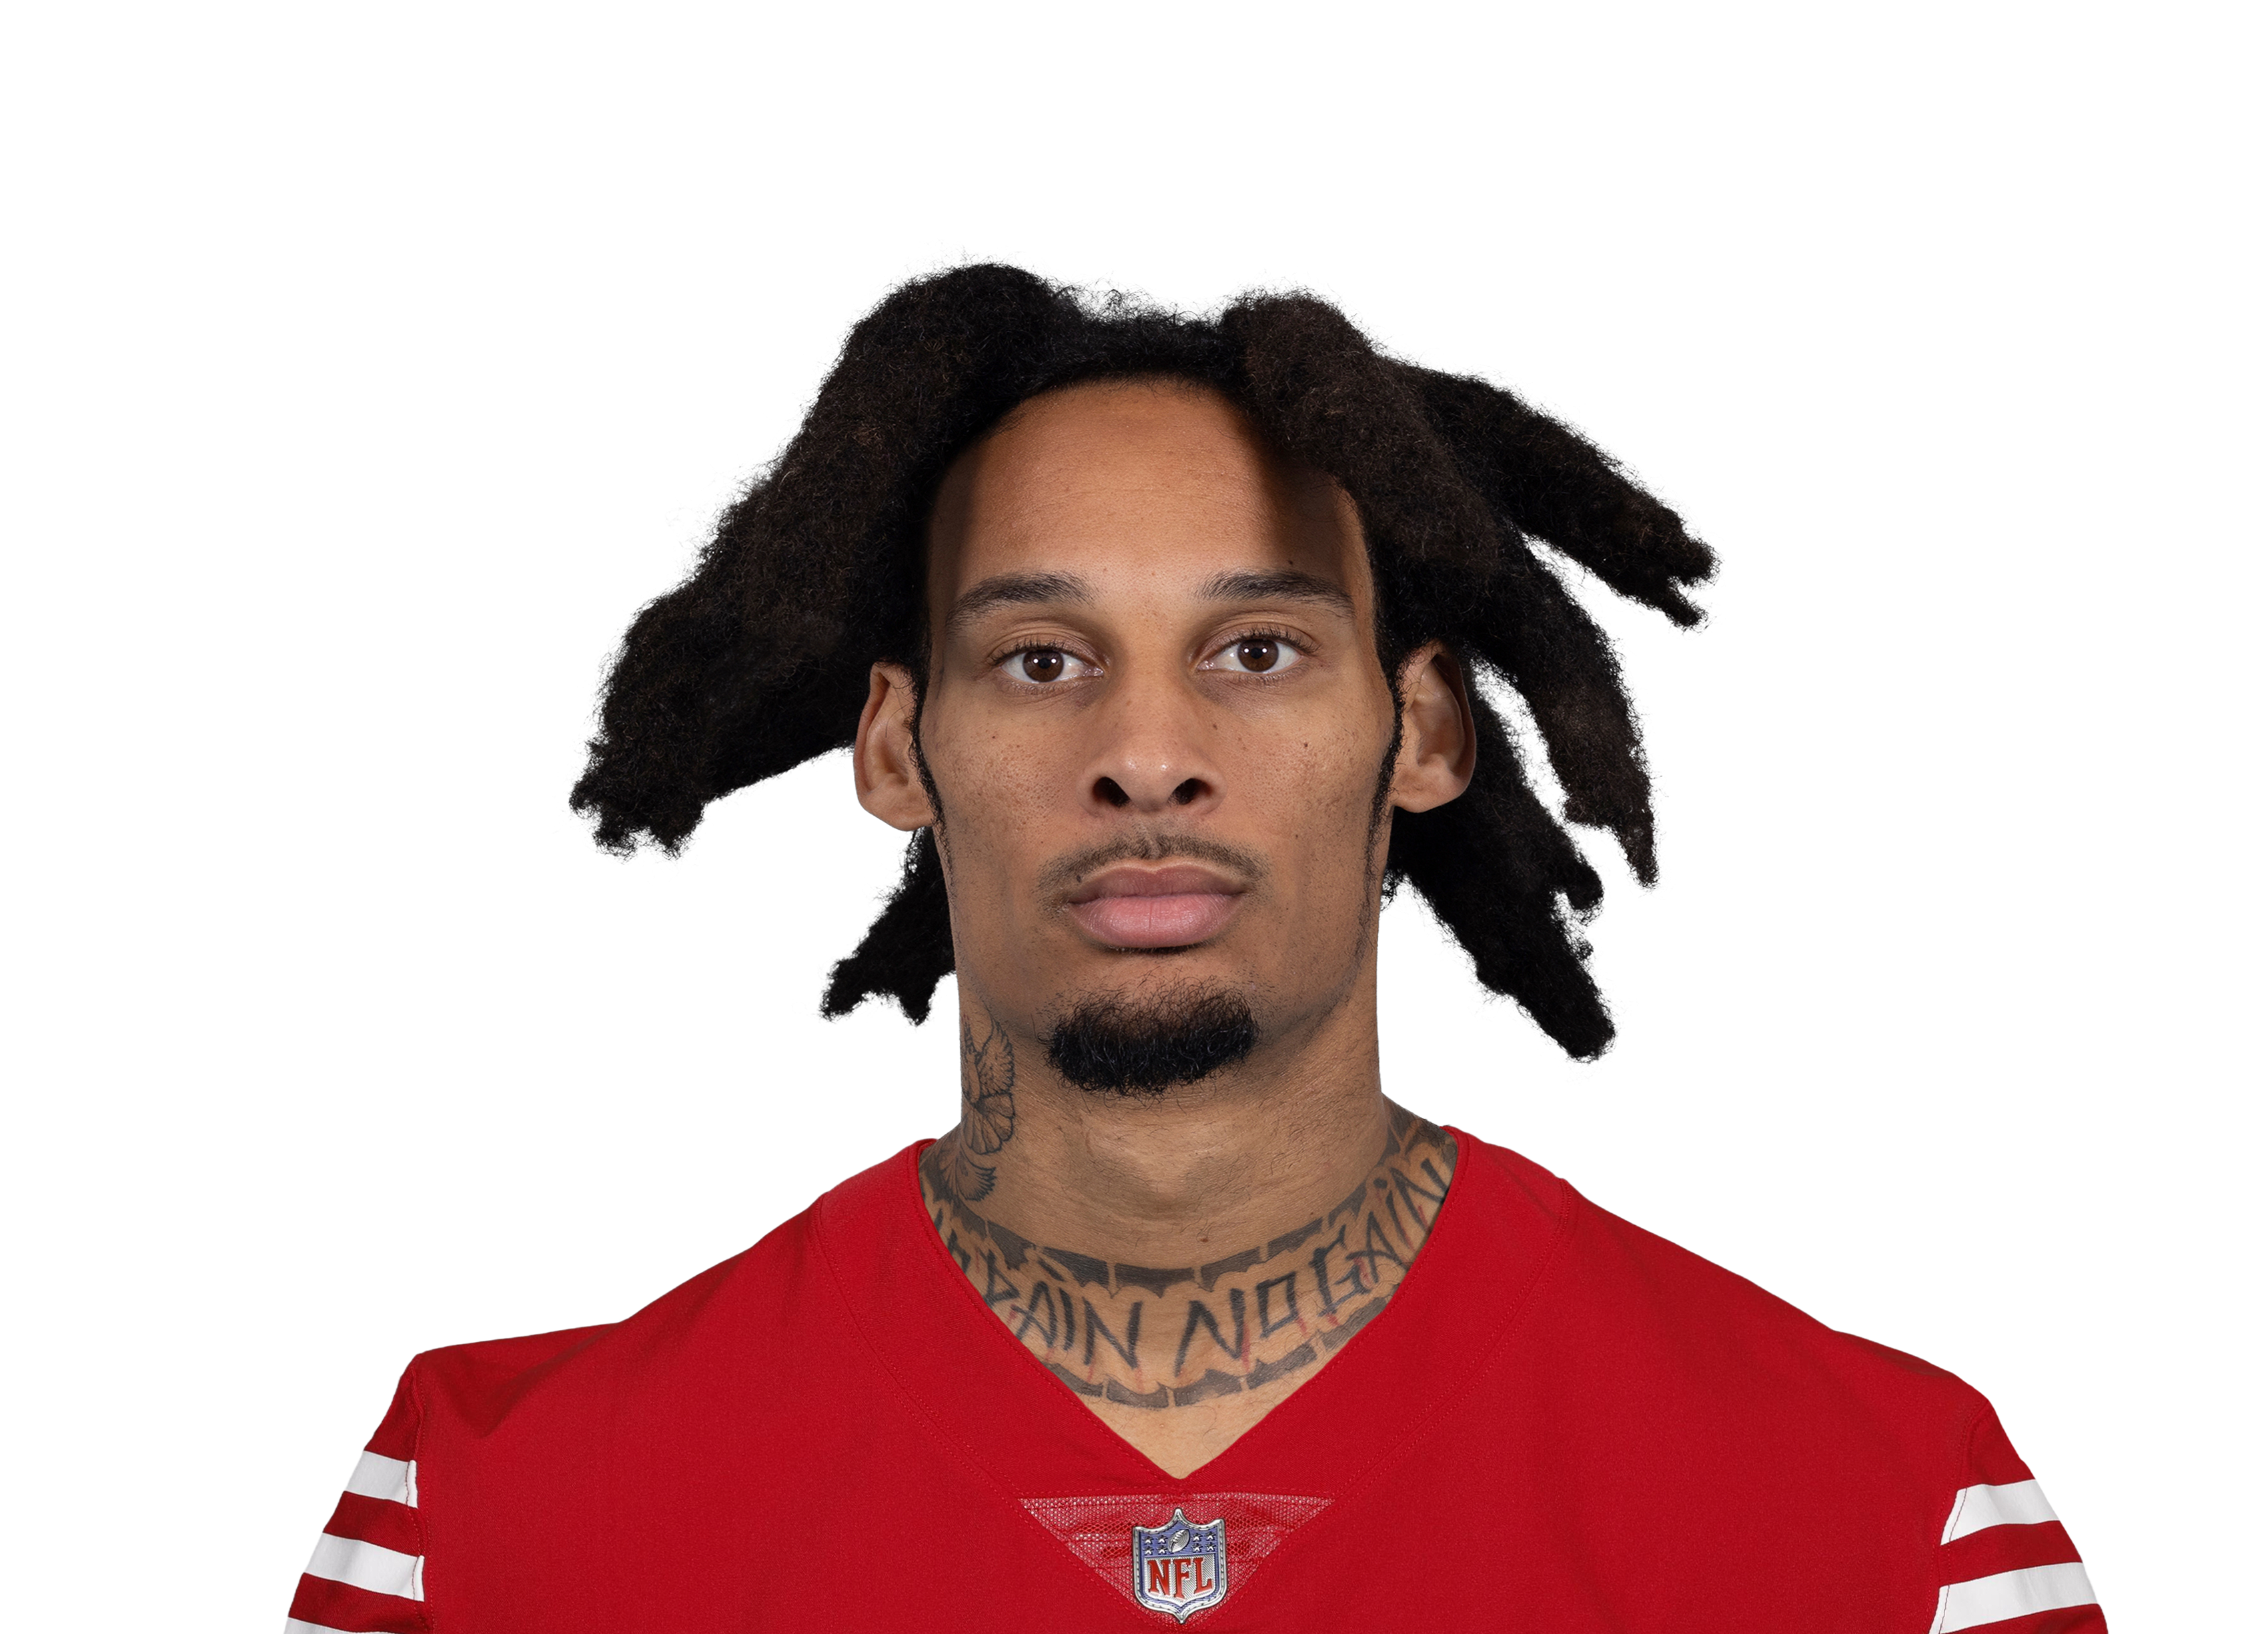

No projection this week
Robbie doesn't have a projection right now — either his team is on a bye, the week's slate hasn't been simulated yet, or he isn't in a position to draw usage. His game log and the usage read below are the real record either way, and this page picks him back up as soon as there's a game to simulate.
How much he's on the field
40% — that's Robbie's average snap share over 20 games. That's a limited role, and it caps everything else on this page. A player on a third of the snaps can't produce like a starter no matter how efficient he is, and the projection reflects the opportunity rather than the talent. This is the number to check first on any football page. Everything else here is downstream of it.
What kind of receiver he is
Robbie has caught 22 of 50 targets (44%) for 332 yards and 1 touchdown — 6.6 yards per target. Yards per target is the honest efficiency number here, because catch rate mostly measures how far downfield he's used: a slot receiver on screens will always catch more of them than a deep threat, without being better.
His last 5 games
Over that stretch Robbie has 58 total yards. Worth noting: his snap share is trending down — 31% lately against 40% overall. A handful of games is thin evidence in a seventeen-game season. It nudges the projection; it doesn't drive it.
How the model reads him
Robbie's projection starts with the game, not with him. We simulate the matchup drive by drive — how many possessions each side gets, how far they travel, how often they score — and then ask what share of that flows through him given his role. That ordering matters: a productive player on a team that runs 55 plays a game has a lower ceiling than a lesser one on a team that runs 70.
What we'd flag
Read this knowing the limits. A seventeen-game season makes every rate noisy; game script can invert a player's usage inside one afternoon; and depth-chart changes often surface too late to be in the projection. For Robbie specifically, he's on the field for a minority of snaps, which caps the projection regardless of how he's playing.