

MatchWiz

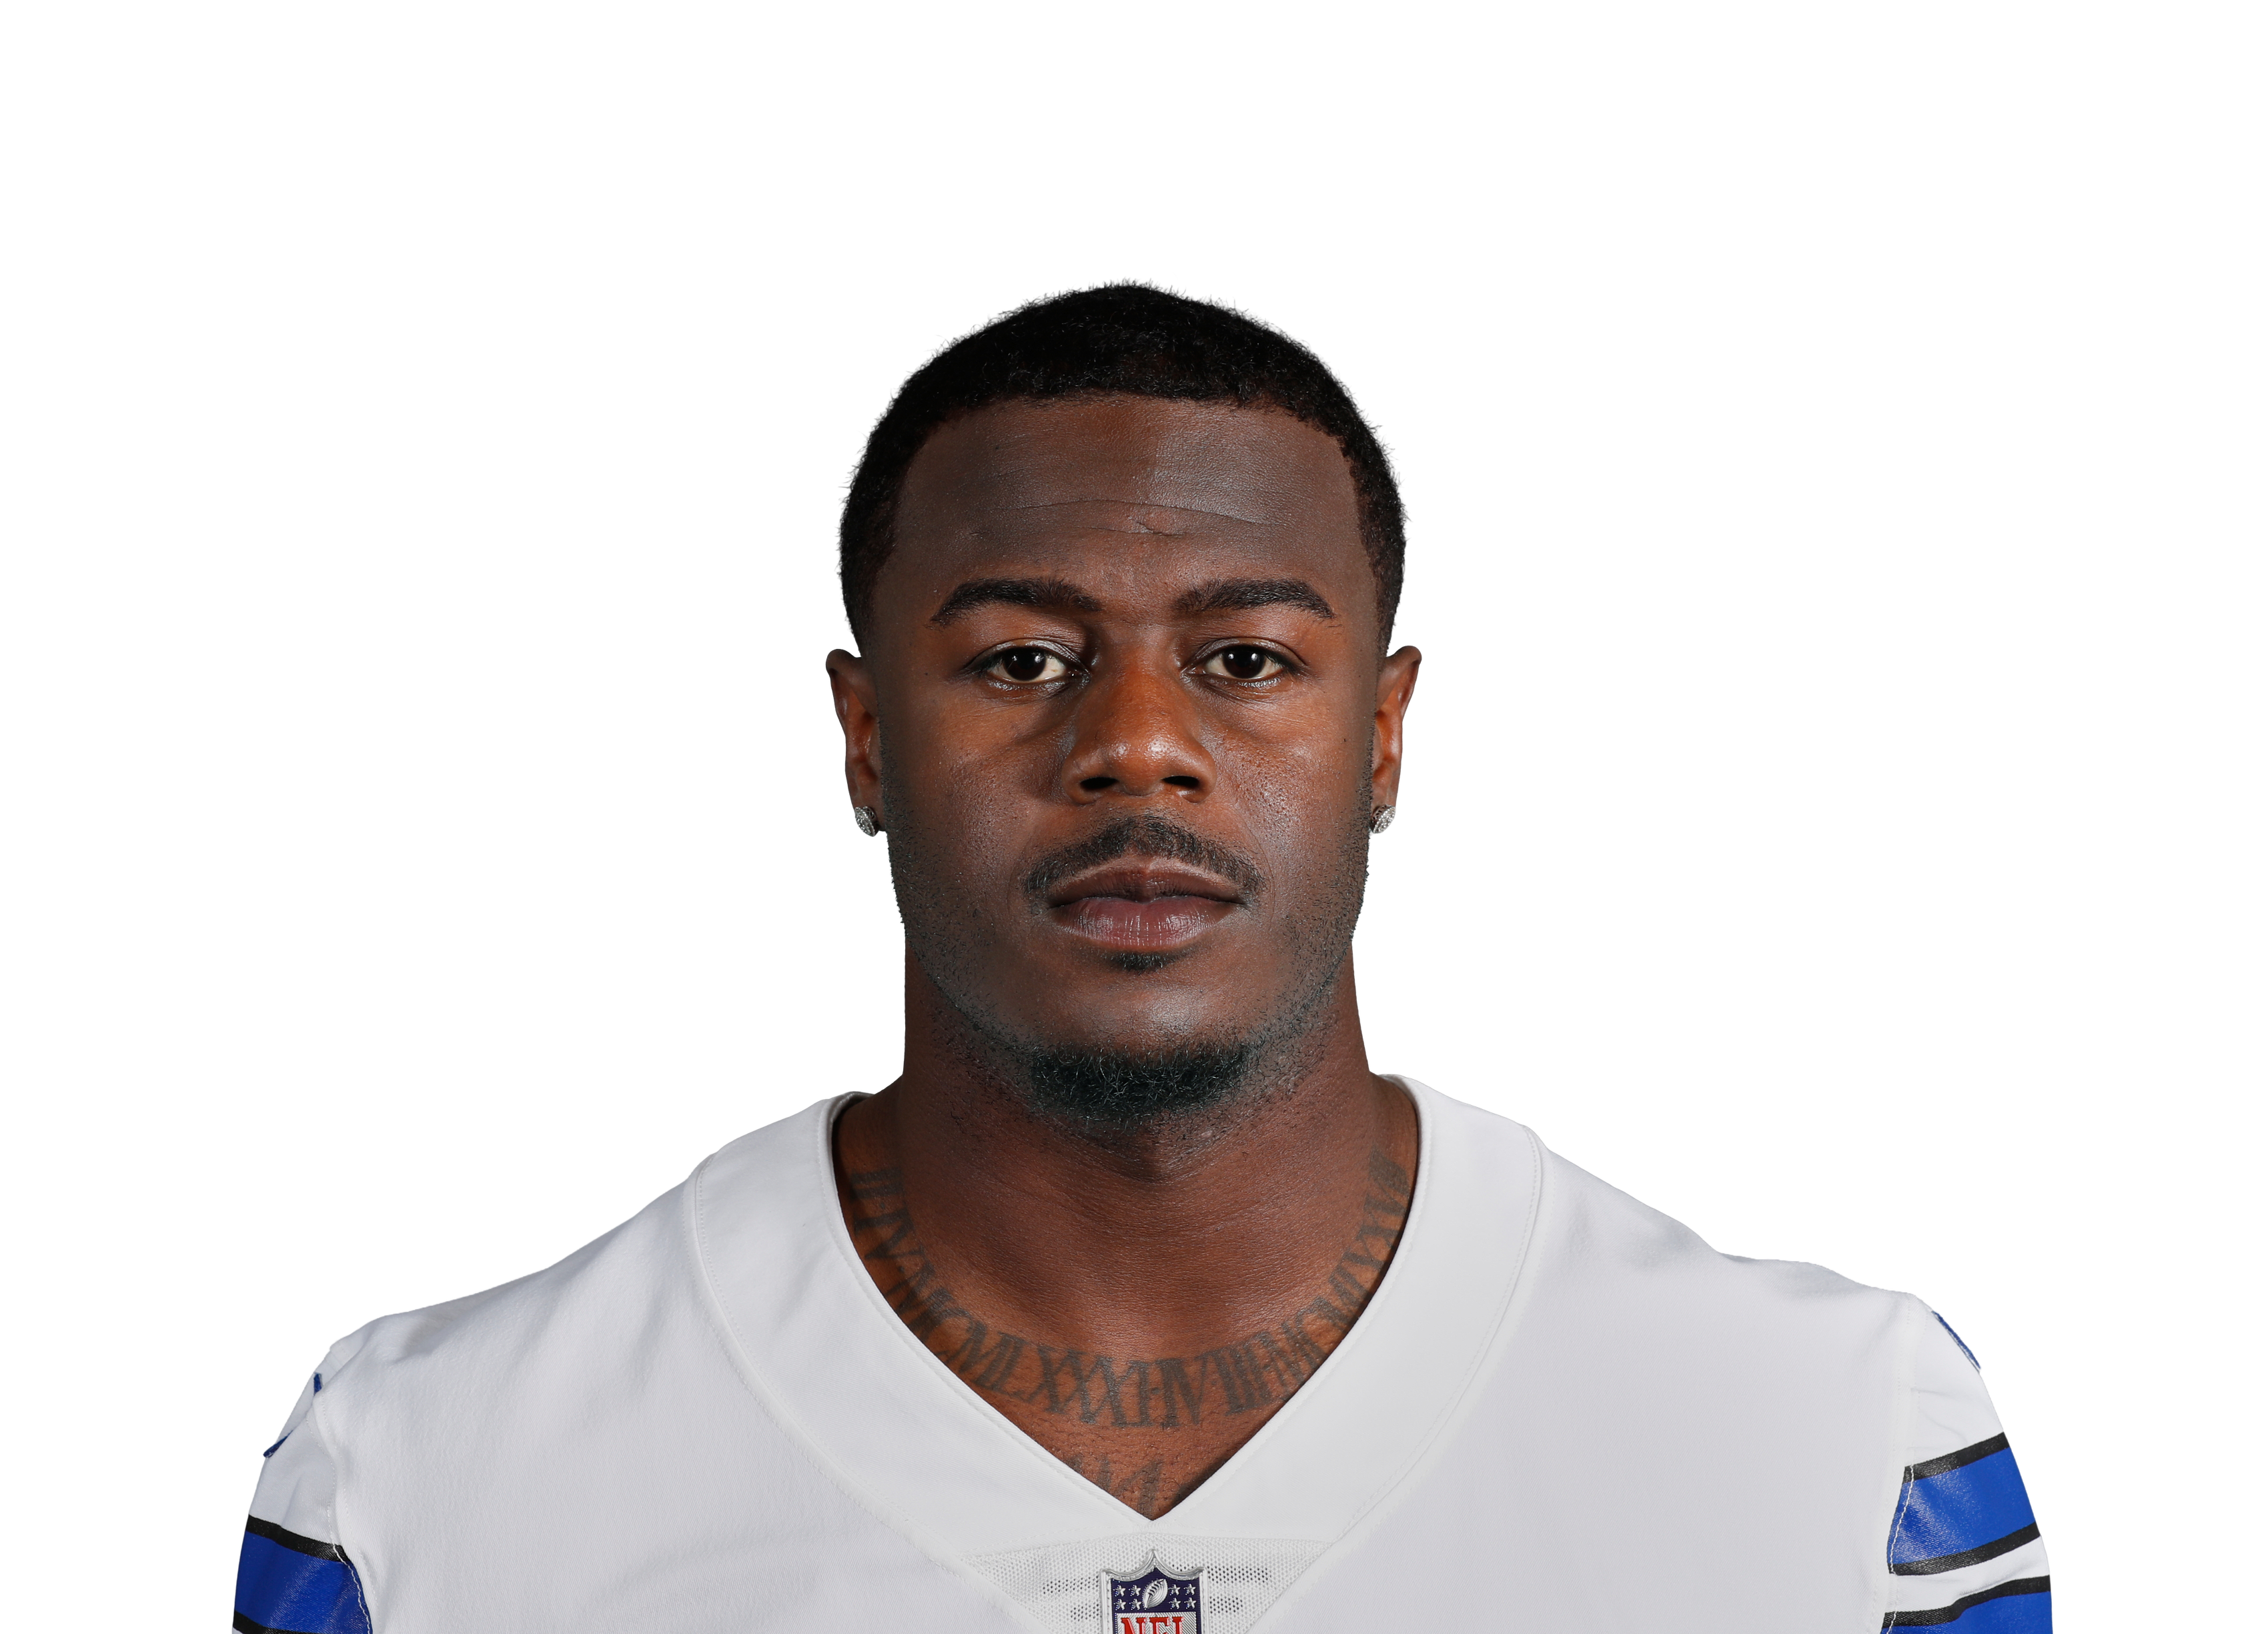
Tyler Johnson

WRDALDallas Cowboys

This week — @ NYG · Sun, Sep 13, 8 PM

Receiving

Targets
1.3
Receptions
0.8
Yards
11
TD
0.13

Touchdown

Anytime TD
13%

Projected from a drive-level simulation of this game, run thousands of times. A projection, not a play — the market is sharper than we are on NFL props, and we say so.

Season Projection

· 21 pts · WR109 · 7.4 games
3@NYG13WSH23BAL33@HOU43TB53@GB63@PHI73ARI83@IND93SF103TEN113PHI123@SEA13BYE143@LAR153JAX163NYG173@WSH18

Projected points per week, from the same simulation as the season total. Bars are scaled to this player's own best week, so the shape shows which weeks carry him. The season number already accounts for the games we expect him to miss; these weekly bars do not — each is what he does in a week he plays.

This week

Tyler is on the road against NYG. We project 11 receiving yards on 1.3 targets. The number comes out of a drive-level simulation of the game rather than a season average — it asks how many possessions his side is likely to get, what they do with them, and how much of that flows through him.

How much he's on the field

47% — that's Tyler's average snap share over 20 games. That's a limited role, and it caps everything else on this page. A player on a third of the snaps can't produce like a starter no matter how efficient he is, and the projection reflects the opportunity rather than the talent. This is the number to check first on any football page. Everything else here is downstream of it.

What kind of receiver he is

Tyler has caught 38 of 59 targets (64%) for 488 yards and 2 touchdowns — 8.3 yards per target. Yards per target is the honest efficiency number here, because catch rate mostly measures how far downfield he's used: a slot receiver on screens will always catch more of them than a deep threat, without being better.

His last 5 games

Over that stretch Tyler has 134 total yards. A handful of games is thin evidence in a seventeen-game season. It nudges the projection; it doesn't drive it.

How the model reads him

Tyler's projection starts with the game, not with him. We simulate the matchup drive by drive — how many possessions each side gets, how far they travel, how often they score — and then ask what share of that flows through him given his role. That ordering matters: a productive player on a team that runs 55 plays a game has a lower ceiling than a lesser one on a team that runs 70.

What we'd flag

Read this knowing the limits. A seventeen-game season makes every rate noisy; game script can invert a player's usage inside one afternoon; and depth-chart changes often surface too late to be in the projection.

Tyler Johnson — FAQ

What is Tyler Johnson projected for this week?

Tyler Johnson faces NYG on the road. The projection on this page comes from a drive-level simulation of that game — possessions, how far each side moves, and what share flows through him — rather than from a season average.

How much does Tyler Johnson play?

He's averaged 47% of his team's snaps across 20 games in our log. Snap share is the most stable input on this page — it moves slowly and it survives a bad game, which is why the model weighs opportunity above efficiency.

Are Tyler Johnson's projections betting advice?

No. Every number here is a research signal from a statistical model, published with the graded record so you can judge it yourself. The model is re-tuned against real results and can be wrong on any given week. Nothing here is a guaranteed outcome. 21+, please play responsibly (1-800-GAMBLER).

Game Log

WkOppSnapsTgtRecRecYdCarRushYdTD
2025 · 17NE16%113000
2025 · 16NO14%117000
2025 · 10CLE63%100000
2025 · 8CIN78%5364001
2025 · 7CAR25%3360000
2025 · 6DEN19%100000
2025 · 3TB70%3232000
2025 · 2BUF96%100000
2025 · 1PIT52%2231000
2024 · 18SEA76%7435001
2024 · 13NO14%100000
2024 · 12PHI20%1111000
2024 · 10MIA14%4325000
2024 · 9SEA38%5338000
2024 · 8MIN38%116000
2024 · 7LV91%7457000
2024 · 4CHI16%100000
2024 · 3SF50%4320000
2024 · 2ARI87%3220000
2024 · 1DET65%7579000

Not betting advice — 21+, play responsibly (1-800-GAMBLER).