
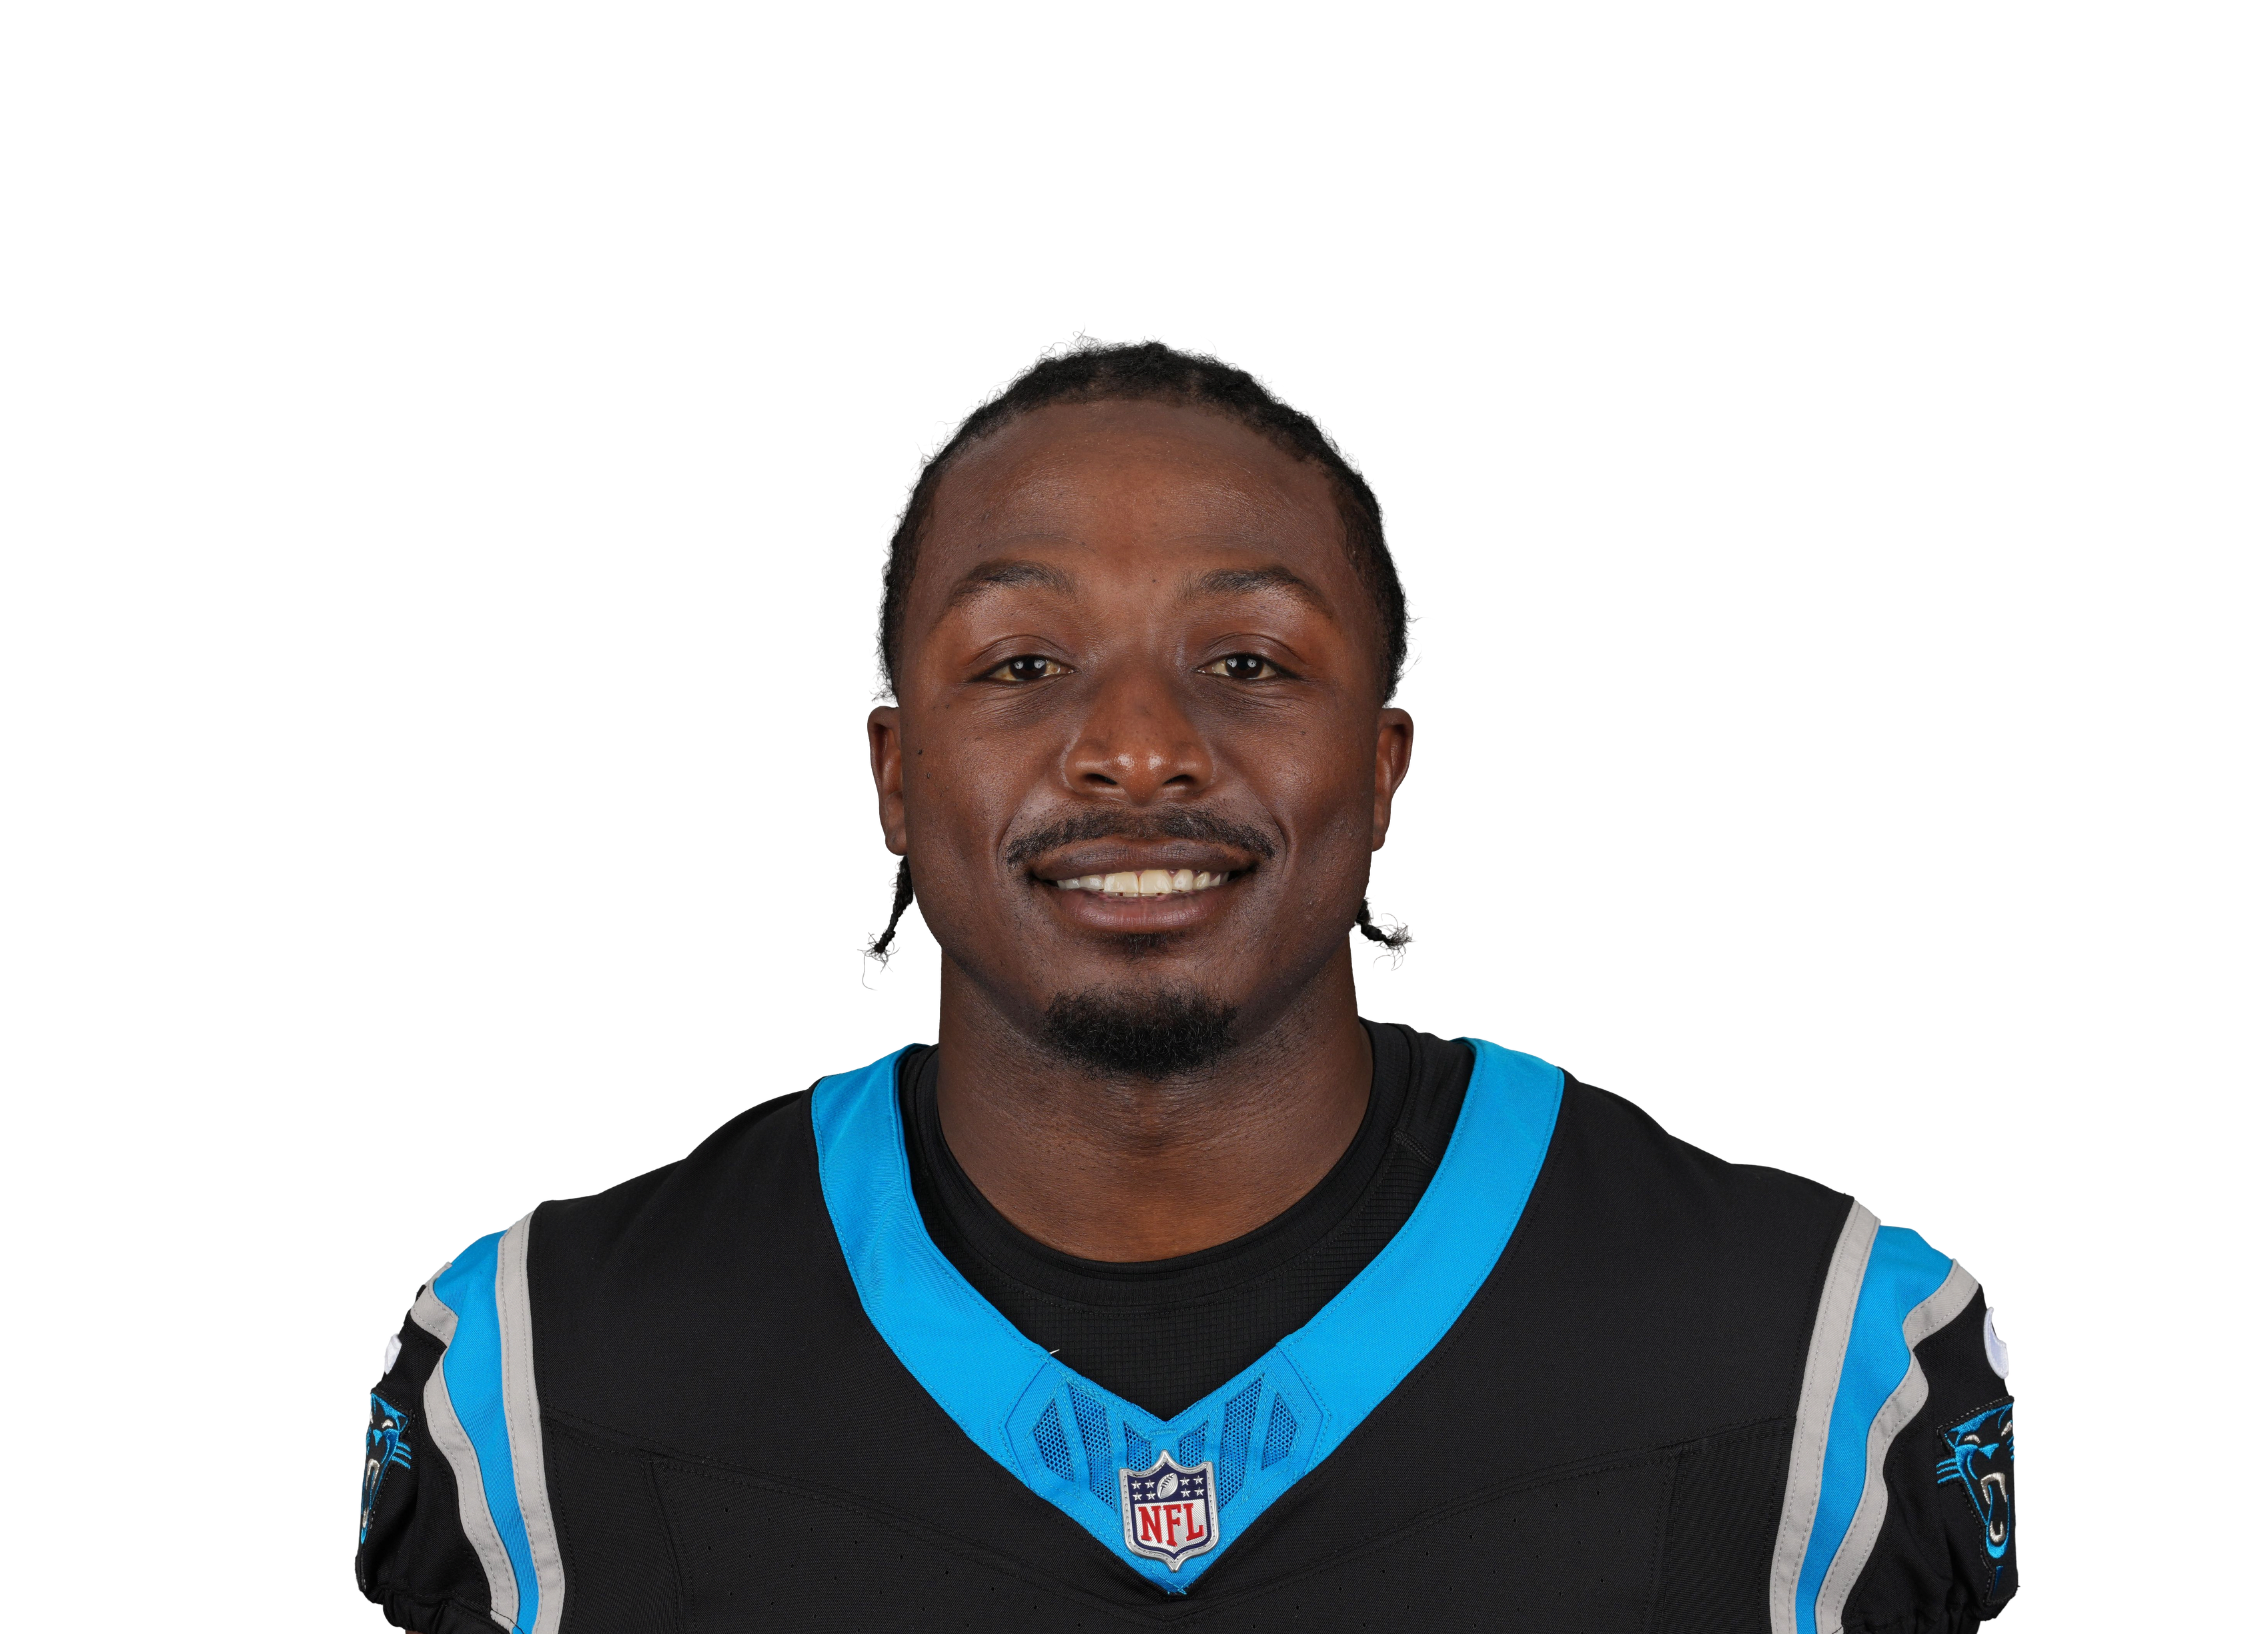

This week
David is hosting DEN. The number comes out of a drive-level simulation of the game rather than a season average — it asks how many possessions his side is likely to get, what they do with them, and how much of that flows through him.
How much he's on the field
David has averaged 50% of his team's snaps across 20 games. That's a rotational-to-starter share. It's the number most likely to move his projection week to week, because a swing of ten points of snap share moves everything downstream with it. Opportunity is the first thing the model reads and the last thing it gives up on — production without snaps is noise, and snaps without production usually corrects.
What kind of receiver he is
David has caught 31 of 55 targets (56%) for 356 yards and 3 touchdowns — 6.5 yards per target. Yards per target is the honest efficiency number here, because catch rate mostly measures how far downfield he's used: a slot receiver on screens will always catch more of them than a deep threat, without being better.
His last 5 games
Over that stretch David has 27 total yards. Worth noting: his snap share is trending down — 8% lately against 50% overall. In a sport with seventeen games, a five-game window is closer to an anecdote than a trend — which is why usage, not this, anchors the number.
How the model reads him
The number on David is a share of a simulated game. First the matchup: possessions, field position, how each offense is likely to move. Then his slice of it, set by usage rather than by reputation. How those pieces are weighted is ours and gets re-tuned against results; the output is published and graded, which is the half you can check.
What we'd flag
Football's sample sizes are brutal — seventeen games a season means a "trend" is often four data points. Injuries and game script move usage more than talent does week to week, and a blowout can erase a starter's second half.