
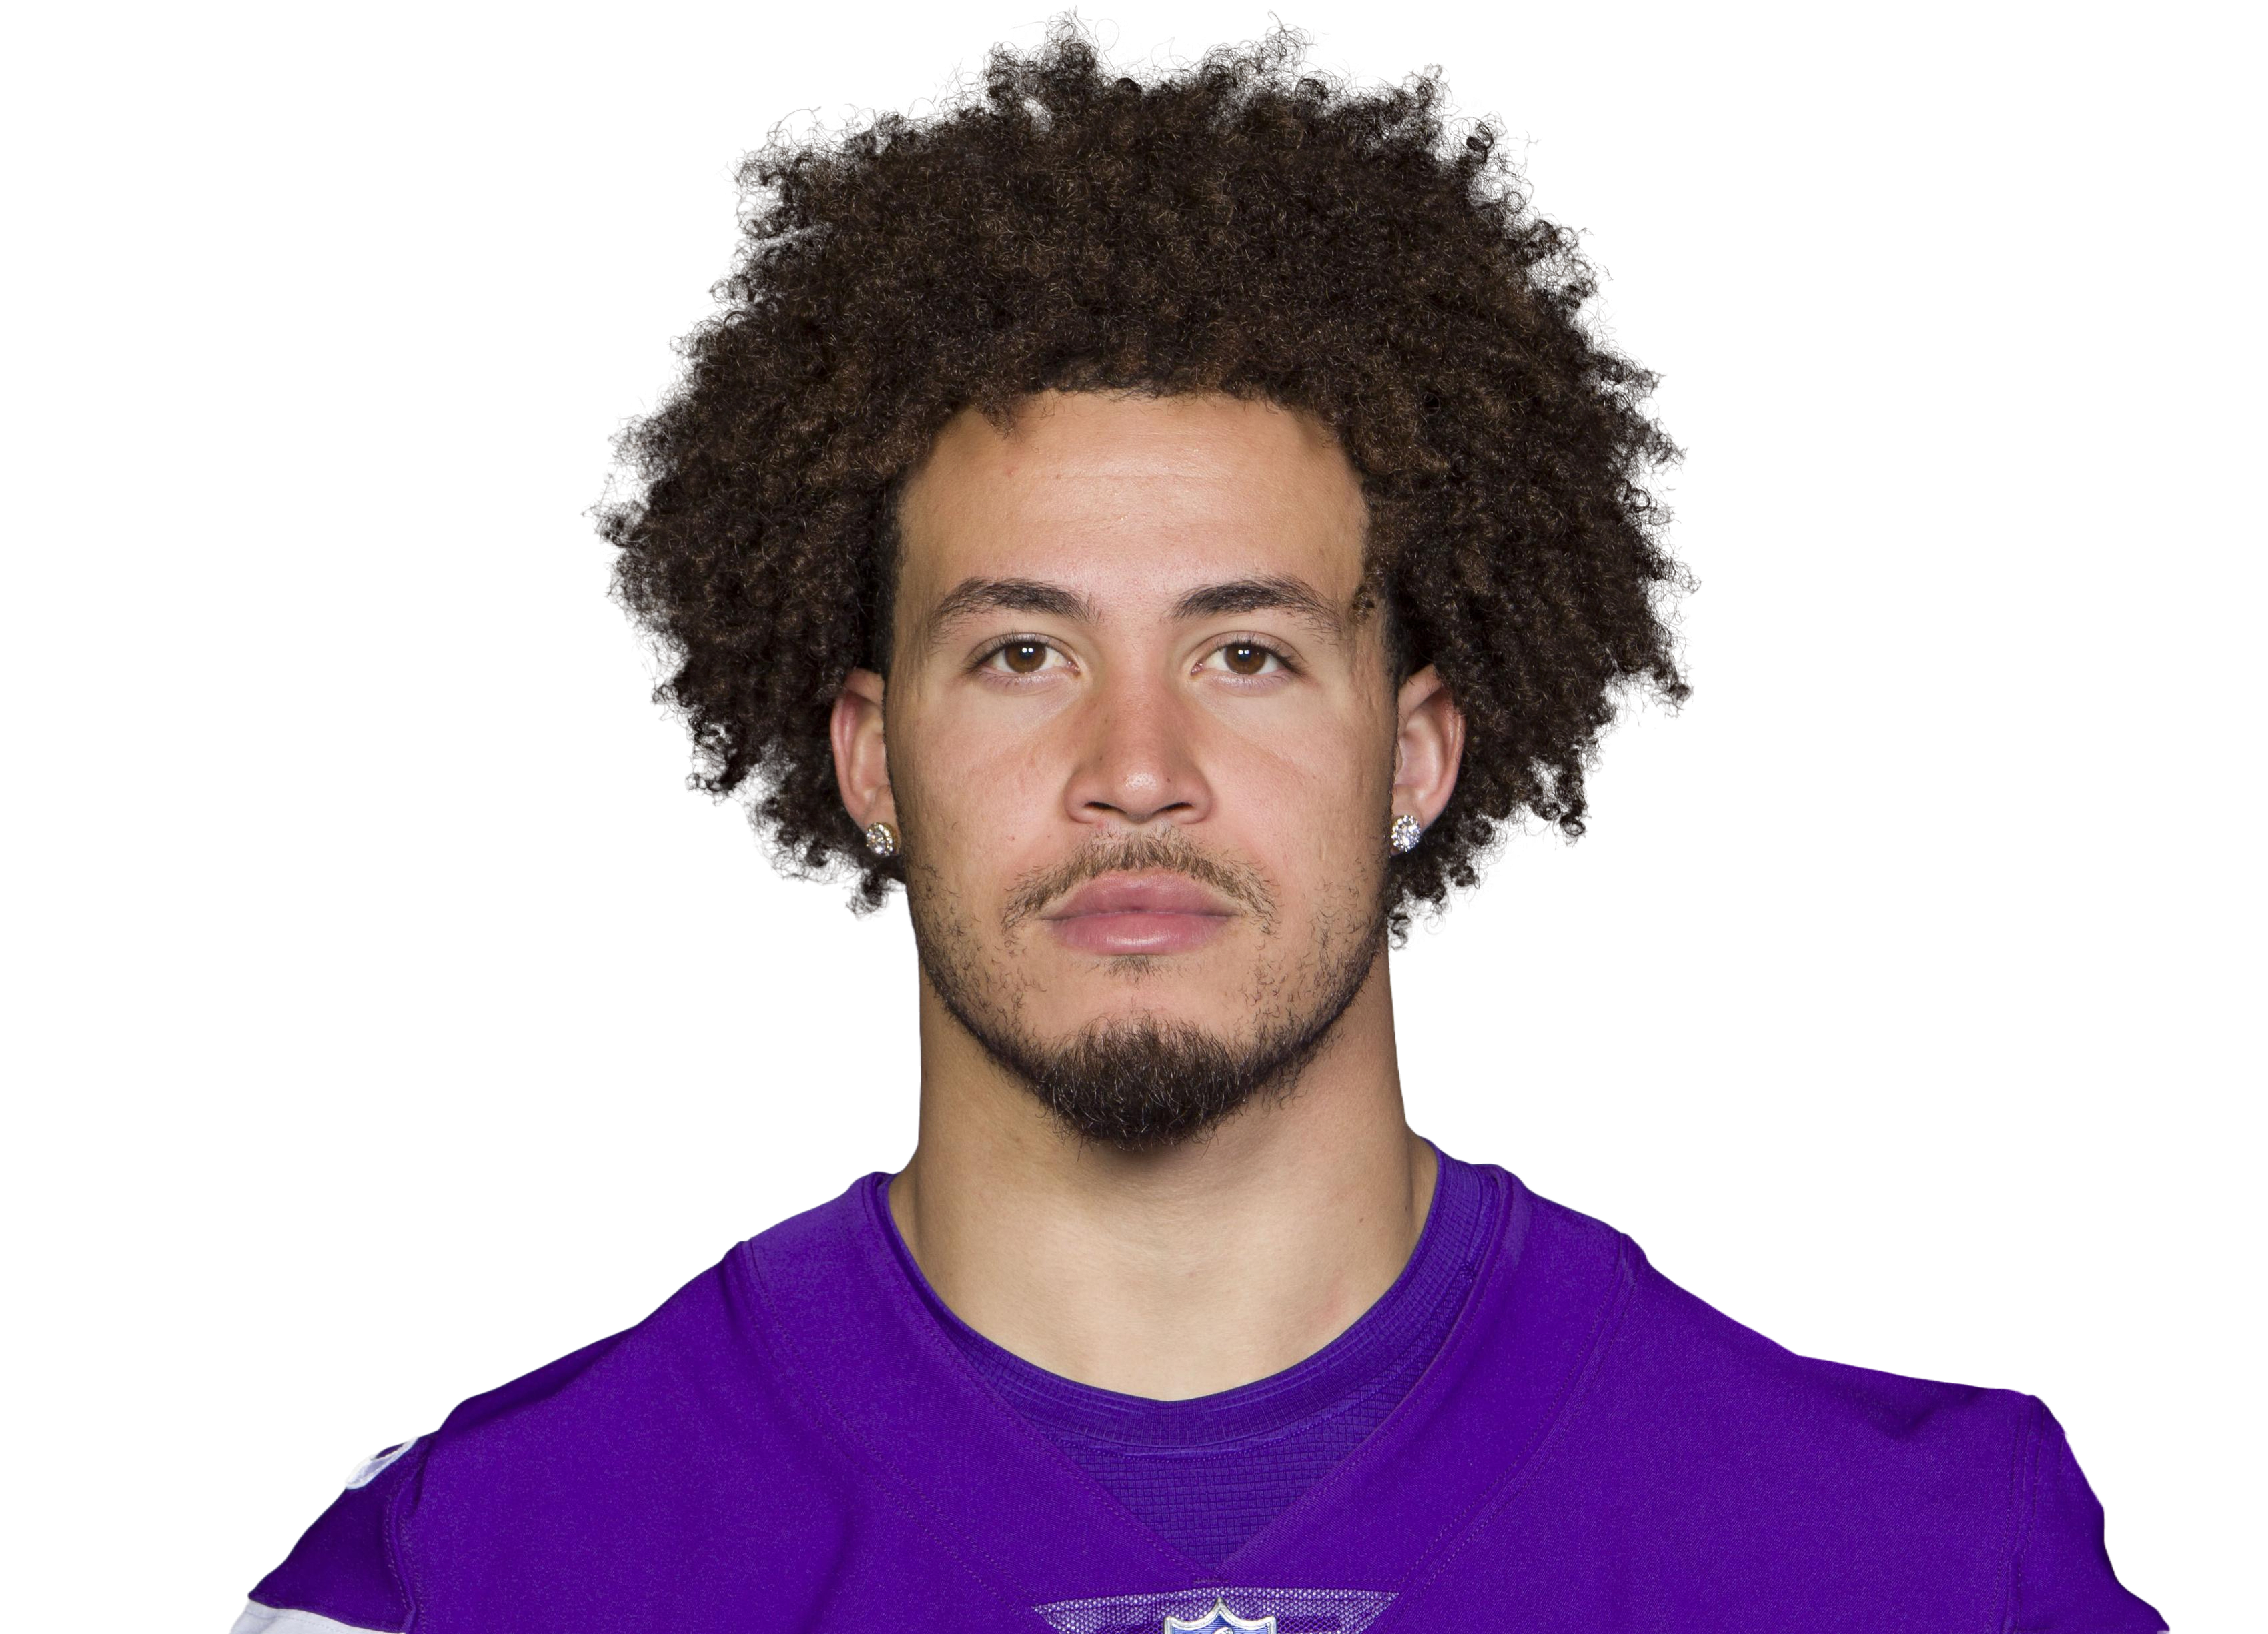

This week
Byron is on the road against NO. We project 4.5 tackles. The number comes out of a drive-level simulation of the game rather than a season average — it asks how many possessions his side is likely to get, what they do with them, and how much of that flows through him.
How much he's on the field
97% — that's Byron's average snap share over 20 games. That's a full-time role. Snap share at this level is the most stable input we have — it changes slowly, and it survives a bad game in a way that yardage never does. This is the number to check first on any football page. Everything else here is downstream of it.
What kind of defensive back he is
Byron has 85 tackles across 20 games — 4.3 a game. Tackle volume is a strange stat for a defensive back: the best coverage players sometimes post the fewest, because nothing is thrown their way. A rising tackle count can mean he's playing well in run support or that receivers are catching the ball in front of him, and the box score can't tell you which.
His last 5 games
Over that stretch Byron has 22 tackles. A handful of games is thin evidence in a seventeen-game season. It nudges the projection; it doesn't drive it.
How the model reads him
Byron's projection starts with the game, not with him. We simulate the matchup drive by drive — how many possessions each side gets, how far they travel, how often they score — and then ask what share of that flows through him given his role. That ordering matters: a productive player on a team that runs 55 plays a game has a lower ceiling than a lesser one on a team that runs 70.
What we'd flag
Read this knowing the limits. A seventeen-game season makes every rate noisy; game script can invert a player's usage inside one afternoon; and depth-chart changes often surface too late to be in the projection.