

MatchWiz

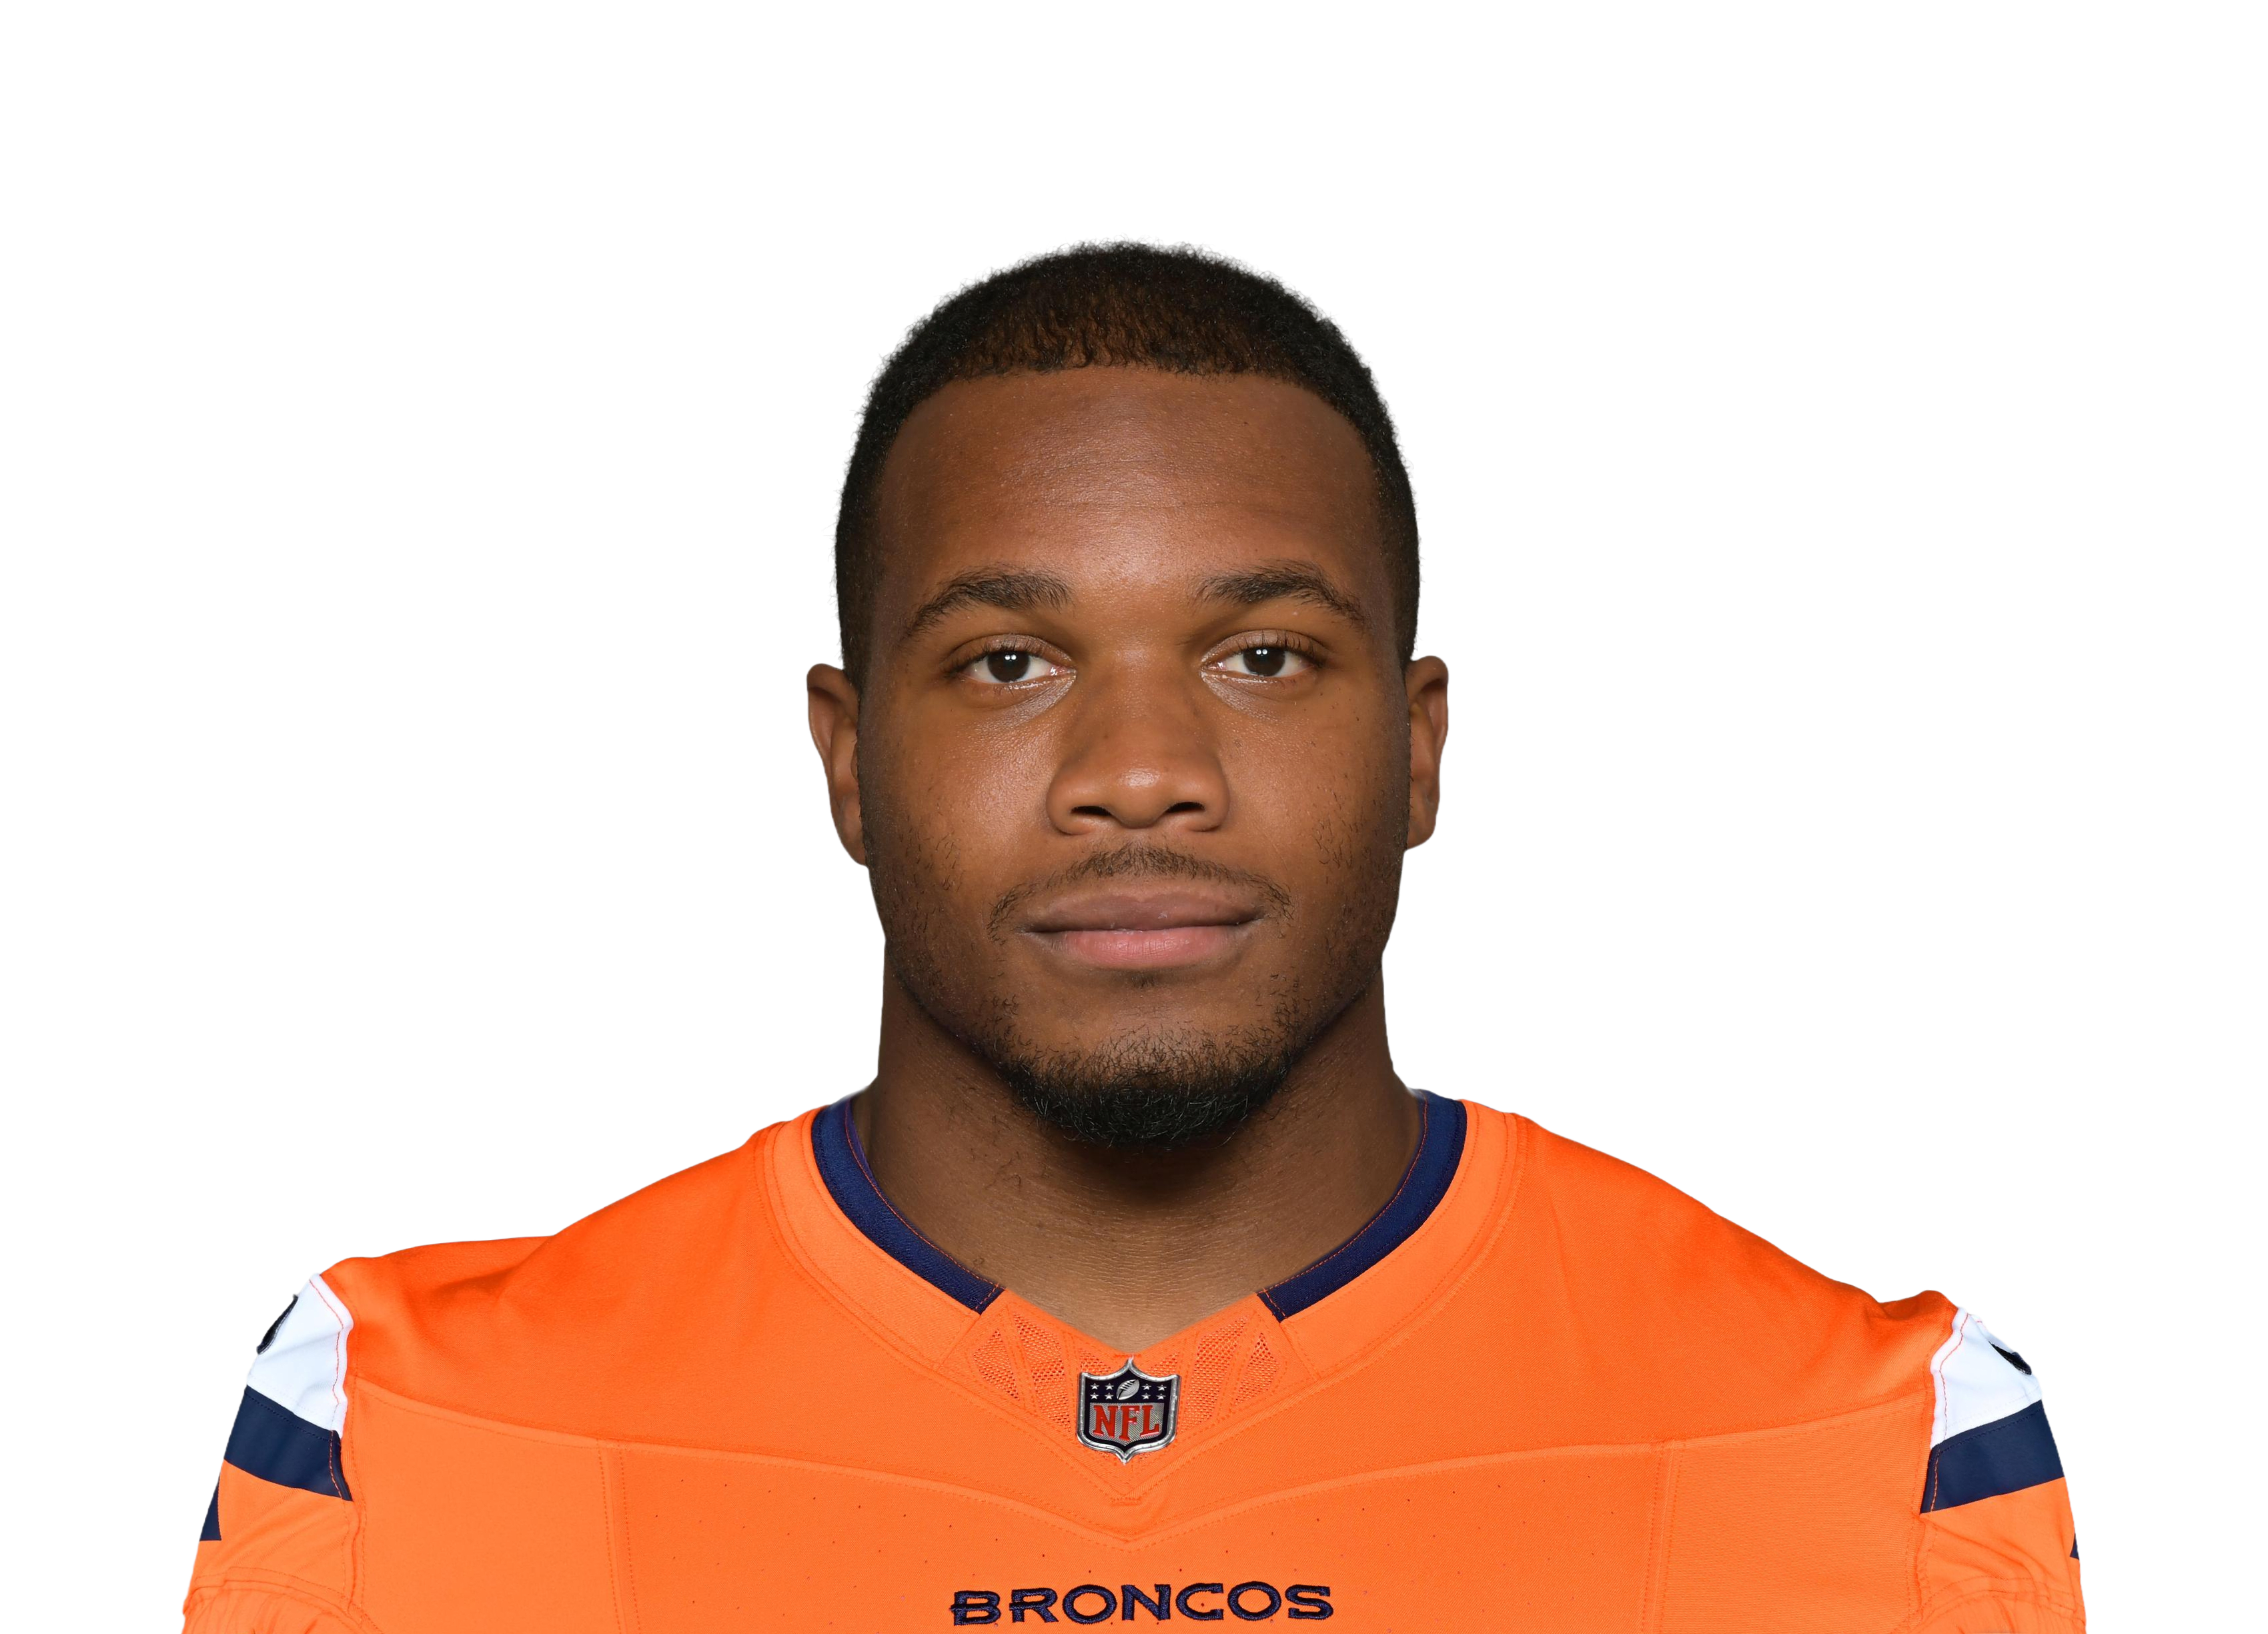
J.K. Dobbins

RBDENDenver Broncos

This week — @ LAC · Sun, Oct 11, 4 PM

Rushing

Carries
12.2
Yards
48
TD
0.26

Receiving

Targets
0.9
Receptions
0.7
Yards
5
TD
0.05

Touchdown

Anytime TD
26%

Projected from a drive-level simulation of this game, run thousands of times. A projection, not a play — the market is sharper than we are on NFL props, and we say so.

Posted Props

J.K. Dobbins: posted prop lines with our projection and both sides' odds on the over
MarketLineWizLineOverMkt
Rushing yardsunder49.547.542%50%
Carriesunder13.512.236%52%

The book's line, J.K.'s projected number, and both sides' odds on the over — ours out of the same simulation as the projection above, the market's de-vigged so the hold isn't counted as disagreement. Where they split, the market is usually right. We grade ourselves against it and we lose on NFL props, so read this as a reference point, not a play.

Rest of Season

· 96 pts · RB23 · 10.0 games
8@LAC59SEA610@ARI710KC810@CAR9—BYE1010LV1110@PIT1211MIA1311@NYJ1410@LV1510BUF168@NE179LAC18

Projected points per week, from the same simulation as the season total. Bars are scaled to this player's own best week, so the shape shows which weeks carry him. The season number already accounts for the games we expect him to miss; these weekly bars do not — each is what he does in a week he plays.

This week

J.K. is on the road against LAC. We project 47.6 rushing yards. The number comes out of a drive-level simulation of the game rather than a season average — it asks how many possessions his side is likely to get, what they do with them, and how much of that flows through him.

How much he's on the field

J.K. has averaged 51% of his team's snaps across 20 games. That's a rotational-to-starter share. It's the number most likely to move his projection week to week, because a swing of ten points of snap share moves everything downstream with it. Opportunity is the first thing the model reads and the last thing it gives up on — production without snaps is noise, and snaps without production usually corrects.

What kind of back he is

J.K. has 277 carries for 1244 yards (4.5 a carry) and 7 rushing touchdowns. He's also seen 32 targets for 99 yards — pass-game work is what separates a back who plays on third down from one who leaves the field, and it's worth more to a projection than the same yardage on the ground. Running-back yardage swings hard on the blocking in front of him, which is why the model weighs opportunity — carries and targets — above efficiency.

His last 5 games

Over that stretch J.K. has 261 total yards. Worth noting: his snap share is trending down — 42% lately against 51% overall. In a sport with seventeen games, a five-game window is closer to an anecdote than a trend — which is why usage, not this, anchors the number.

How the model reads him

The number on J.K. is a share of a simulated game. First the matchup: possessions, field position, how each offense is likely to move. Then his slice of it, set by usage rather than by reputation. How those pieces are weighted is ours and gets re-tuned against results; the output is published and graded, which is the half you can check.

What we'd flag

Football's sample sizes are brutal — seventeen games a season means a "trend" is often four data points. Injuries and game script move usage more than talent does week to week, and a blowout can erase a starter's second half.

J.K. Dobbins — FAQ

What is J.K. Dobbins projected for this week?

J.K. Dobbins faces LAC on the road. The projection on this page comes from a drive-level simulation of that game — possessions, how far each side moves, and what share flows through him — rather than from a season average.

How much does J.K. Dobbins play?

He's averaged 51% of his team's snaps across 20 games in our log. Snap share is the most stable input on this page — it moves slowly and it survives a bad game, which is why the model weighs opportunity above efficiency.

Are J.K. Dobbins's projections betting advice?

No. Every number here is a research signal from a statistical model, published with the graded record so you can judge it yourself. The model is re-tuned against real results and can be wrong on any given week. Nothing here is a guaranteed outcome. 21+, please play responsibly (1-800-GAMBLER).

Game Log

WkOppSnapsTgtRecRecYdCarRushYdTD
2026 · 4SF32%221211400
2026 · 3LAR49%21417490
2026 · 2JAX34%00010360
2026 · 1KC43%0008360
2025 · 10LV52%11718770
2025 · 9HOU46%11-215610
2025 · 8DAL52%2210151110
2025 · 7NYG49%11-114810
2025 · 6NYJ50%10014400
2025 · 5PHI53%11520790
2025 · 4CIN44%114161010
2025 · 3LAC67%21011830
2025 · 2IND45%21914760
2025 · 1TEN53%22516630
2024 · 19HOU61%1009260
2024 · 18LV65%331218630
2024 · 17NE53%11719760
2024 · 12BAL30%53196400
2024 · 11CIN73%11311560
2024 · 10TEN66%33515500

Not betting advice — 21+, play responsibly (1-800-GAMBLER).