

MatchWiz

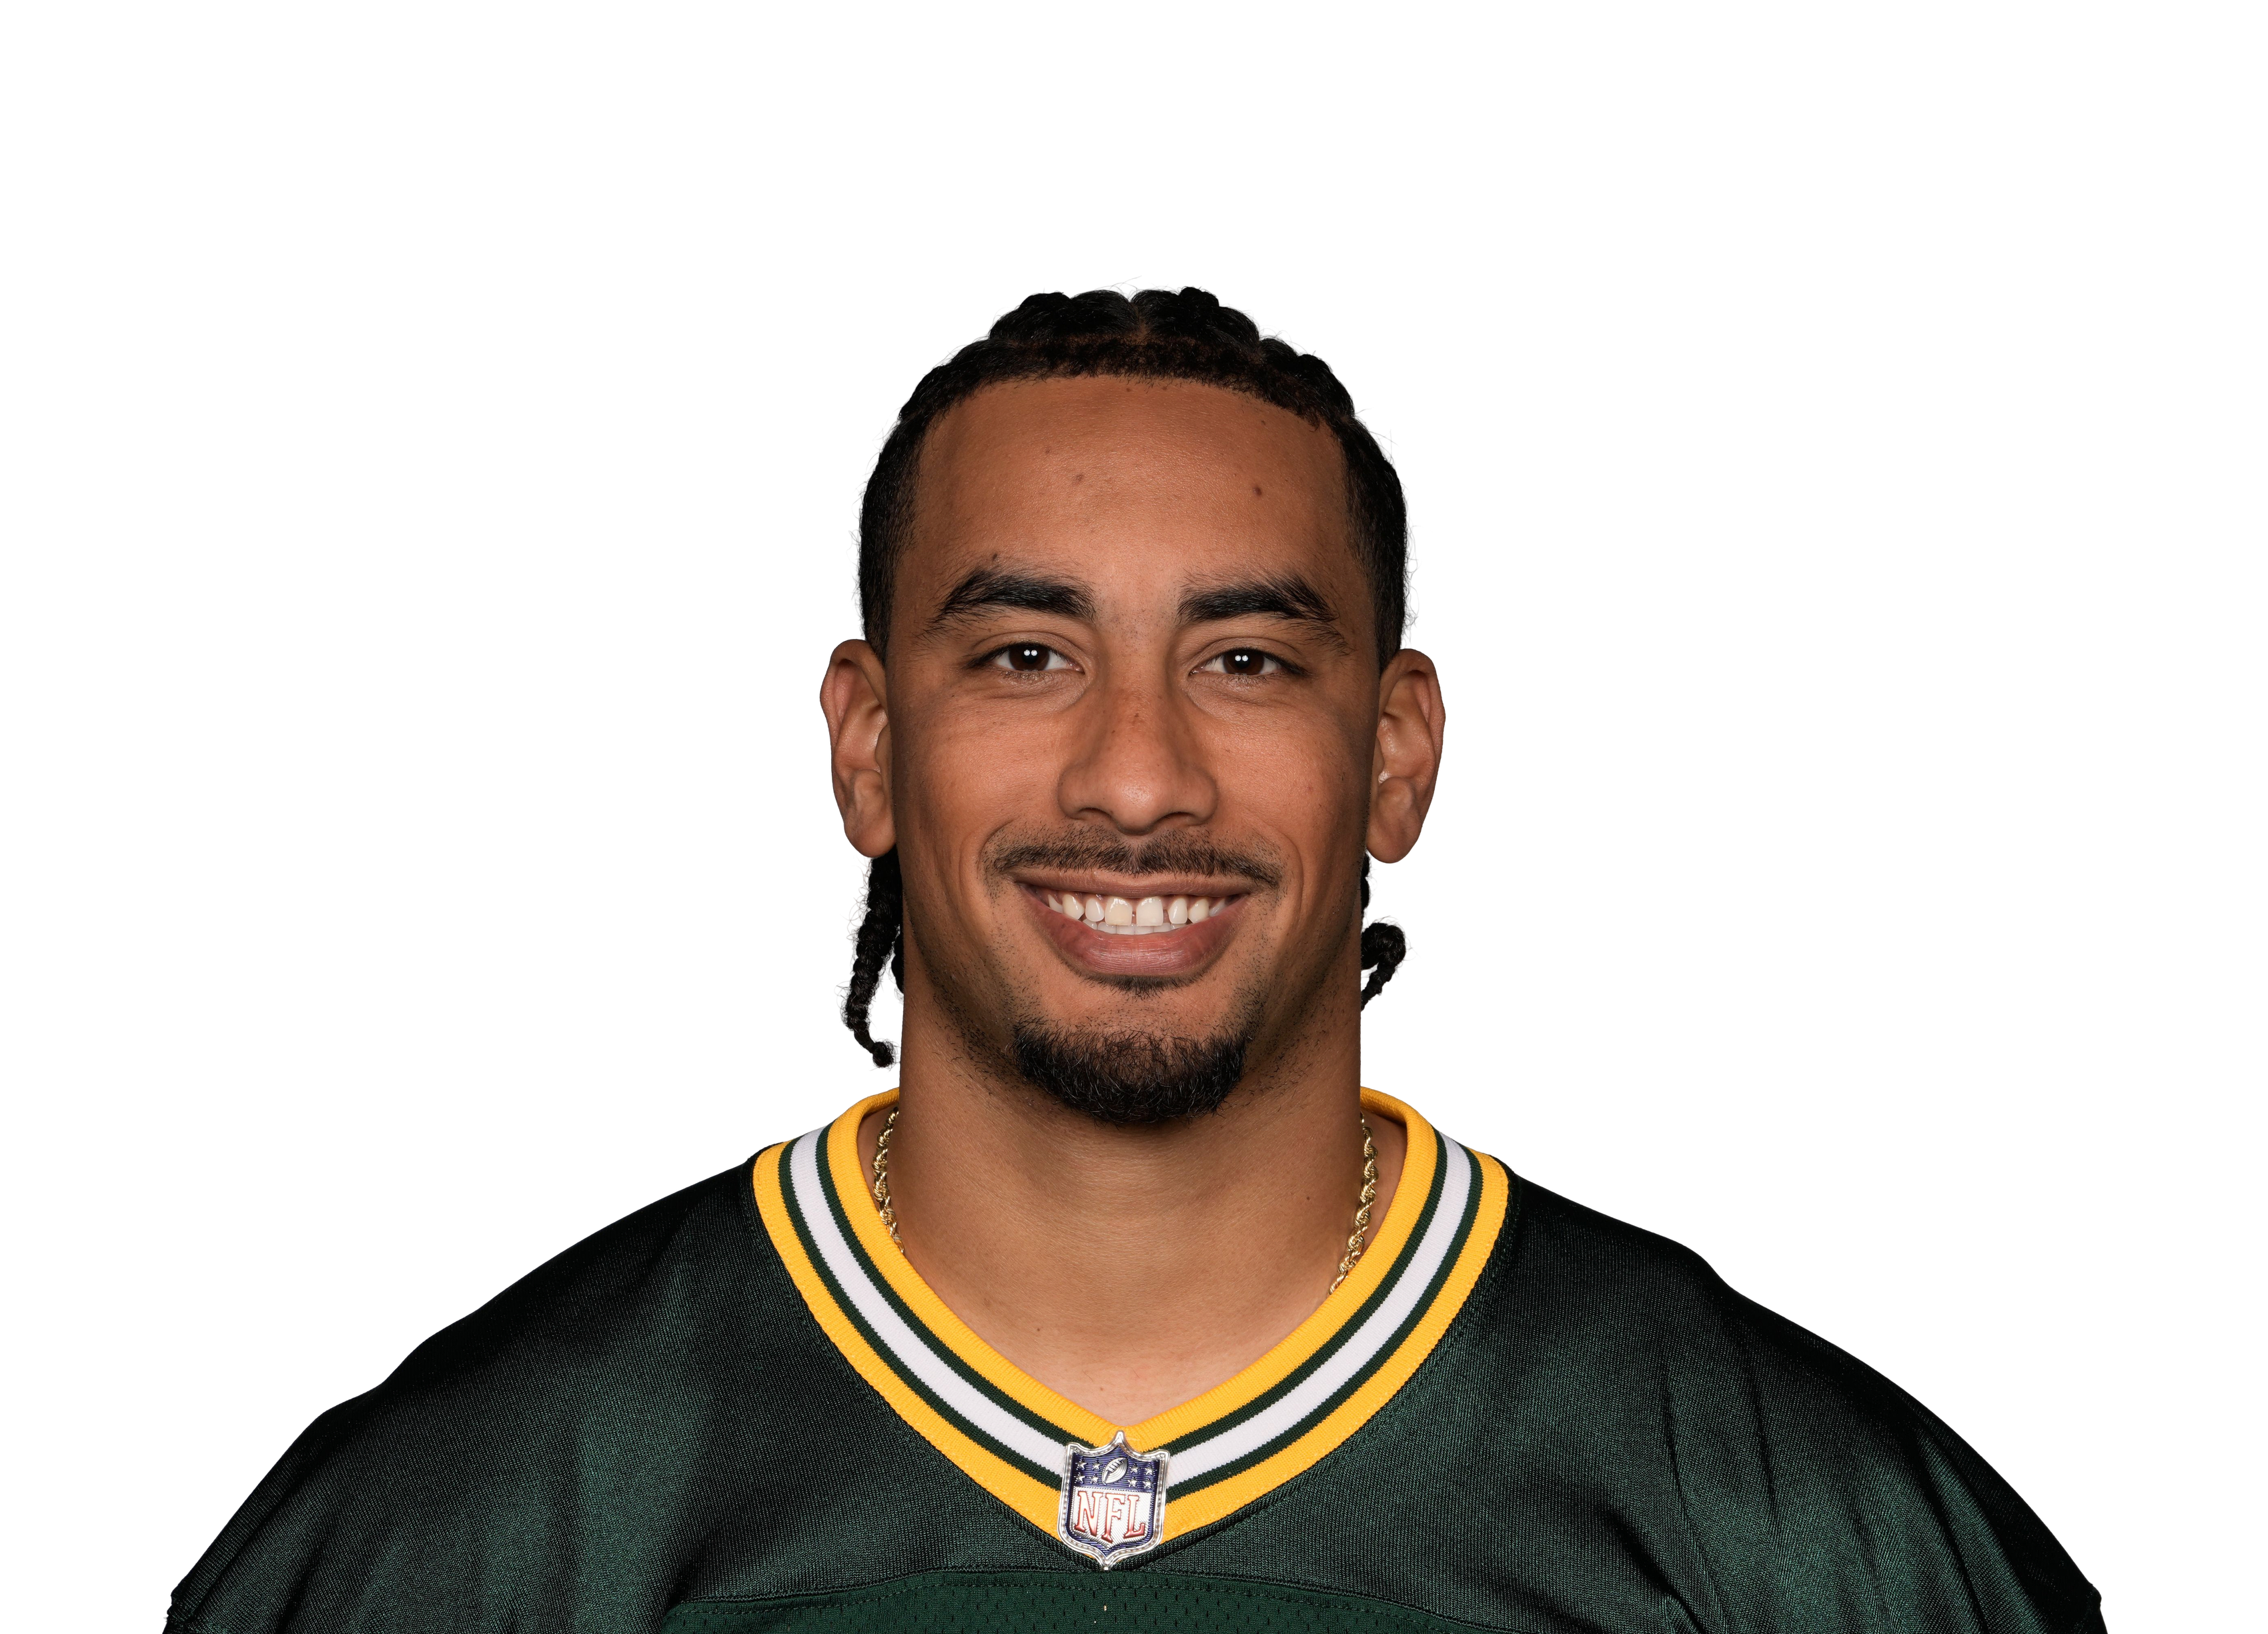
Jordan Love

QBGBGreen Bay Packers

This week — vs CHI · Sun, Oct 11, 1 PM

Passing

Cmp / Att
21.6 / 33.7
Yards
246
TD
1.3
INT
0.7

Rushing

Carries
1.4
Yards
5
TD
0.07

Touchdown

Anytime TD
7%

Projected from a drive-level simulation of this game, run thousands of times. A projection, not a play — the market is sharper than we are on NFL props, and we say so.

Posted Props

Jordan Love: posted prop lines with our projection and both sides' odds on the over
MarketLineWizLineOverMkt
Passing yardsover22824656%50%
Completionsin line20.521.655%52%
Pass attemptsin line33.533.749%50%
Passing TDsunder1.51.339%45%
Interceptionsin line0.50.751%53%

The book's line, Jordan's projected number, and both sides' odds on the over — ours out of the same simulation as the projection above, the market's de-vigged so the hold isn't counted as disagreement. Where they split, the market is usually right. We grade ourselves against it and we lose on NFL props, so read this as a reference point, not a play.

Rest of Season

· 201 pts · QB4 · 10.2 games
21CHI524DAL620@DET721CAR818@NE917MIN10—BYE1120@LAR1218@NO1320BUF1422MIA1520@CHI1617HOU1721DET18

Projected points per week, from the same simulation as the season total. Bars are scaled to this player's own best week, so the shape shows which weeks carry him. The season number already accounts for the games we expect him to miss; these weekly bars do not — each is what he does in a week he plays.

This week

Jordan is hosting CHI. We project 246.4 passing yards, 5.5 rushing yards. The number comes out of a drive-level simulation of the game rather than a season average — it asks how many possessions his side is likely to get, what they do with them, and how much of that flows through him.

How much he's on the field

Across 20 games, Jordan has been on the field for 96% of his team's snaps. That's a full-time role. Snap share at this level is the most stable input we have — it changes slowly, and it survives a bad game in a way that yardage never does. The model weighs this above efficiency for a simple reason: snap share predicts next week better than last week's yardage does.

What kind of quarterback he is

Jordan has completed 402 of 639 (63%) for 4745 yards, 35 touchdowns and 9 interceptions — 7.4 yards an attempt. He's also run for 202 yards, which matters more than it looks: rushing production is the most reliable floor a quarterback has, because it doesn't depend on anyone catching anything. Yards per attempt is the number to watch: completion percentage rewards checkdowns, and a quarterback can complete 70% of his passes without ever threatening anybody.

His last 5 games

Over that stretch Jordan has 1367 total yards. Five games is a small sample in any sport and a tiny one in football, where a team plays seventeen times a year — so recent form informs the projection without overriding the usage underneath it.

How the model reads him

Every projection here is built the same way for Jordan as for a starter on a contender — simulate the game, then apportion it by role. No manual adjustments, no gut calls on who's due. The weighting behind it is proprietary and re-tuned on real outcomes; everything it produces is public and graded against the box score.

What we'd flag

Three things to carry. The season is seventeen games, so most trends here are small samples wearing a confident number. Game script rewrites usage — a team trailing throws, a team ahead runs. And injury news lands after we publish.

Jordan Love — FAQ

What is Jordan Love projected for this week?

Jordan Love faces CHI at home. The projection on this page comes from a drive-level simulation of that game — possessions, how far each side moves, and what share flows through him — rather than from a season average.

How much does Jordan Love play?

He's averaged 96% of his team's snaps across 20 games in our log. Snap share is the most stable input on this page — it moves slowly and it survives a bad game, which is why the model weighs opportunity above efficiency.

Are Jordan Love's projections betting advice?

No. Every number here is a research signal from a statistical model, published with the graded record so you can judge it yourself. The model is re-tuned against real results and can be wrong on any given week. Nothing here is a guaranteed outcome. 21+, please play responsibly (1-800-GAMBLER).

Game Log

WkOppSnapsCmpAttYdsTDINTRush
2026 · 4TB100%223019721-8
2026 · 3ATL100%2853312210
2026 · 2NYJ100%1629145200
2026 · 1MIN100%2142387210
2025 · 19CHI100%24463234011
2025 · 16CHI36%81377007
2025 · 15DEN100%24402761229
2025 · 14CHI100%172523431-1
2025 · 13DET100%1830234404
2025 · 12MIN91%14211390015
2025 · 11NYG87%1324174207
2025 · 10PHI100%20361760028
2025 · 9CAR100%2637273011
2025 · 8PIT100%293736030-1
2025 · 7ARI100%19291791022
2025 · 6CIN100%19262591126
2025 · 4DAL100%31433373028
2025 · 3CLE100%18251831118
2025 · 2WSH100%19312922012
2025 · 1DET100%1622188204

Not betting advice — 21+, play responsibly (1-800-GAMBLER).